Experiments with MS Excel: Effects of Bandlimiting - Triangular Waveform
I used the following expression for a triangular waveform to first generate the waveform mathematically and then try and remove the higher harmonics to band limit the signal and study the effect band-limiting had on the shape of the signal.
![]()
The MS Excel file is attached here
The time frame is taken to be from -10 to +10. Since I can’t possibly include infinite components I decided to go for the first 5 harmonics, the expansion would then be as follows.
=(D2-((A2/121)*(SIN(22*3.14*100*B2))))
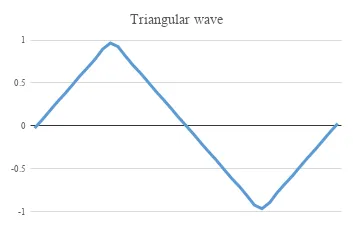
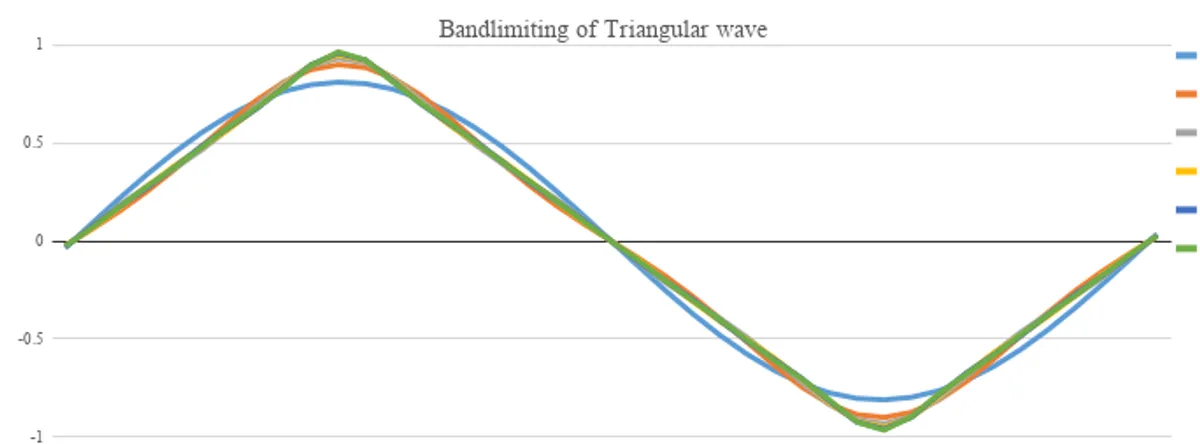
This is the waveform for the signal with 5 harmonics.
Plotting the signal as I keep on cutting down on the number of components.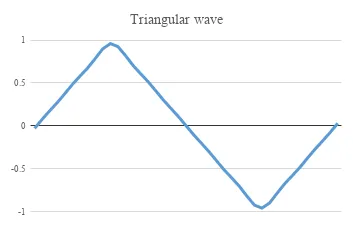


The equation for the signal with only the 1st component would look like this:
=(H2-((A2/9)*(SIN(6*3.14*100*B2))))
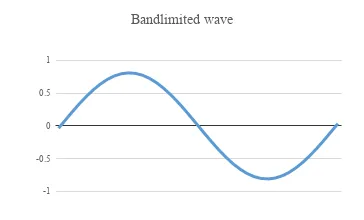
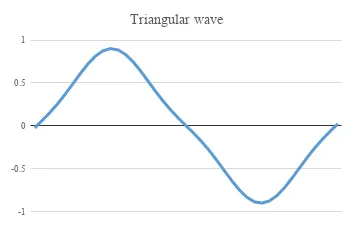 And finally the band-limited signal: taking only the case: n=1 and neglecting all other higher harmonics.
=(A2*(SIN(2*3.14*100*B2)))
Comments