Experiments with MS Excel: Effects of Bandlimiting - Sawtooth Waveform
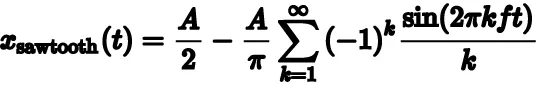
I used the following expression for a sawtooth waveform to first generate the waveform mathematically and then try and remove the higher harmonics to band limit the signal and study the effect band-limiting had on the shape of the signal.
The MS Excel file is attached here
I set the Amplitude, A arbitrarily as 10 and the time frame from -10 to +10. Since I can’t possibly include infinite components I decided to go from k=1 to k=7 the expansion would then be as follows.
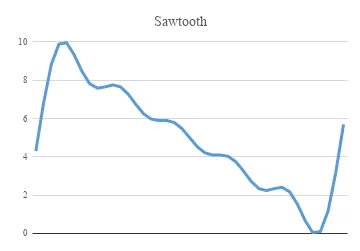
=((A2/2)-((A2/3.14)*(-SIN(2*3.14*100*B2)+((SIN(4*3.14*100*B2))/2)-((SIN(6*3.14*100*B2))/3)+((SIN(8*3.14*100*B2))/4)-((SIN(10*3.14*100*B2))/5)+((SIN(12*3.14*100*B2))/6)-((SIN(14*3.14*100*B2))/7))))
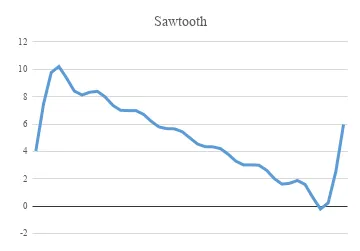
This is the waveform for the signal with 6 harmonics.
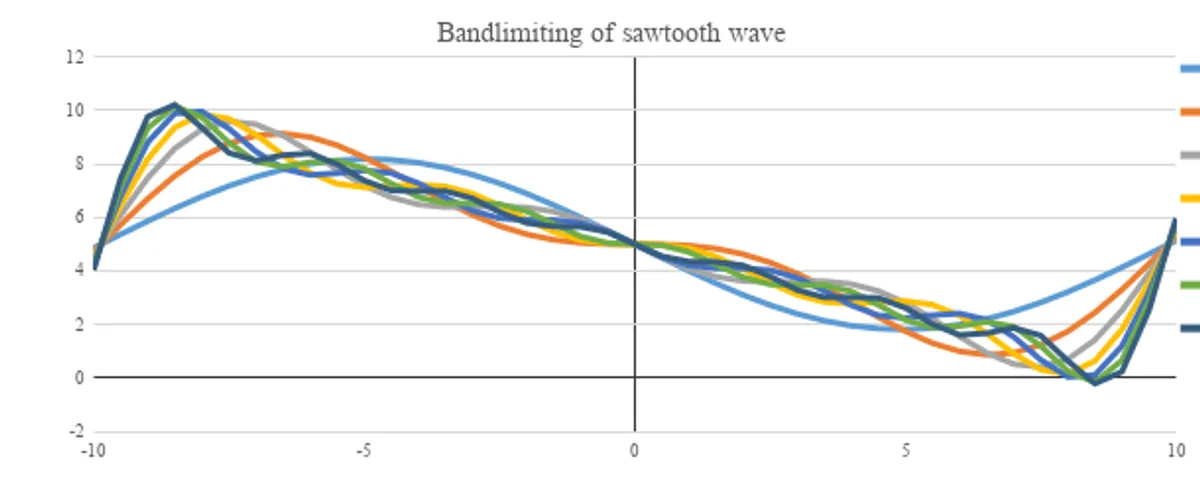
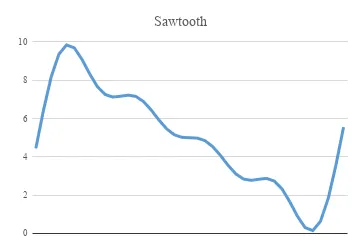
Plotting the signal as I keep on cutting down on the number of components.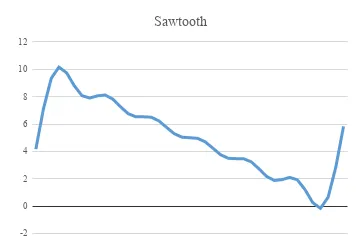
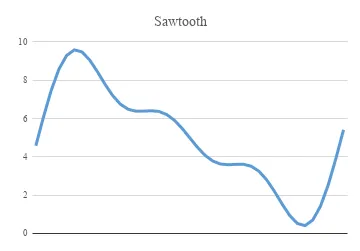
The equation for the signal with only the 1st component would look like this:
=((A2/2)-((A2/3.14)*(-SIN(2*3.14*100*B2)+(SIN(4*3.14*100*B2))/2)))
And finally the band-limited signal: taking only the case: k=1 and neglecting all other higher harmonics.
=((A2/2)+((A2/3.14)*SIN(2*3.14*100*B2)))
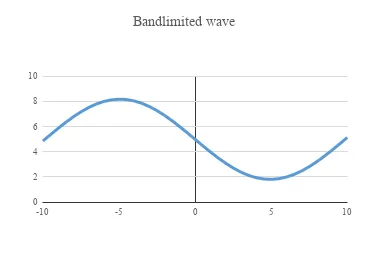
This would be the effect of a filter that removes all the higher components from a sawtooth waveform i.e it is reduced to a sine wave.
Comments