Building a Daily Mood Tracker in Google Sheets
TL;DR for people who came here just for the Mood Tracker
A year back I asked myself this question : Am I happy?
Even though this seems like a pretty straight-forward question, there is more to it as you go deeper.
What does being happy mean?
Why do people get upset so easily? Why do people get dissatisfied so easily? Why is it becoming harder and harder for people to find happiness?
Is happiness something that you should go look for?
If I am happy today, but was not happy yesterday then am I generally happy or not?
If I am happy already, then what’s next?
There were so many such questions popping up in my mind. I really didn’t know the answers to all of them. I decided to just track how my days are going and then slowly figure out the answers along the way.
A daily mood tracker helps one keep a tab on how well we are doing. There might be days when we will be feeling low and not realize it. If you have a system where, at the end of the day you take some time to ask yourself how your day was, you’re more likely to be conscious of how you are feeling and thus more likely to take action if things are going bad.
The next big question was : How do I qualitatively measure how my day was? What would be the metric for that?
I could use the classic : Good, Average, Bad. But this hardly does justice to the complex range of emotions you can likely have associated with a day.
I then came across The Feelings Circle :
This looked perfect. I could use the categories in the innermost circle to categorize the general feeling I had about the day.
I used this for a couple of days and I realized that this does not quantify things linearly. If I were to give a score for each category I can clearly say that ‘Happy’ gets the highest score and ‘Sad’ gets the lowest score. But how do you quantify the rest? I somehow did not like the scattered nature of this metric.
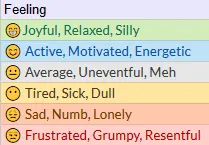
In my pursuit of a way to somehow linearly quantify my days, I came across this metric :
😁Joyful, Relaxed, SillyHighest state of happiness / silliness, usually on holidays, or when spending time with family and doing things you love😊 Active, Motivated, EnergeticThis is the productive, zen-mode of sorts. When you want to get things done at work and meet your goals😐 Average, Uneventful, MehThis is for the average, not so good, not so bad, I don’t know how to quantify this, sort of day😶 Tired, Sick, DullThis is for the days when work gets too stressful or exhausting, or when you are unwell and in bed😞 Sad, Numb, LonelyThis is when you are upset about something, when things have gone wrong, or you are feeling low😒 Frustrated, Grumpy, ResentfulIf you see the stages of grief you will know that it starts with denial and anger. This is why I have classified Frustration / Anger as the last metric
This metric did the job well. It was easier to put my days into these categories.
Another issue that I faced was that of Recency bias, which would inadvertently make me rate my day based on the last few hours instead of the whole day. I guess being aware of this bias helped me avoid it sometimes.
Building the Mood Tracker
I decided to use Google Sheets because of the flexibility a spreadsheet gives over having different apps for the different things that you want to track.
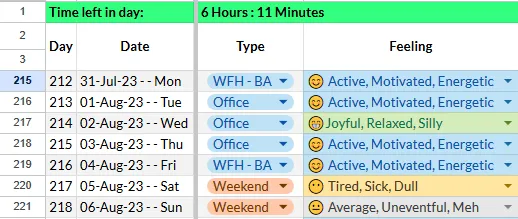
Create rows and columns as shown above. I had an additional column called ‘Type’ just to know if I was working or not.
I used the following Google sheet formula to create another set of columns with the corresponding “scores” for the day.
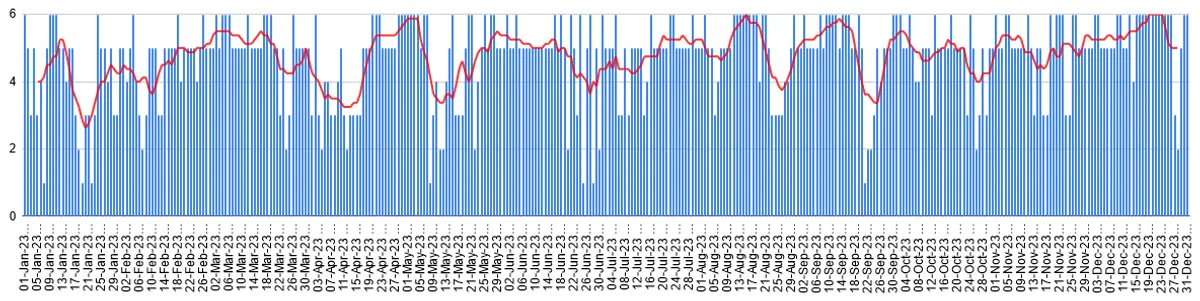
=IF(D215="😁Joyful, Relaxed, Silly", 6, IF(D215="😊 Active, Motivated, Energetic", 5, IF(D215="😐 Average, Uneventful, Meh", 4, IF(D215="😶 Tired, Sick, Dull", 3, IF(D215="😞 Sad, Numb, Lonely", 2, IF(D215="😒 Frustrated, Grumpy, Resentful", 1,0))))))Then I plotted this data on a chart :
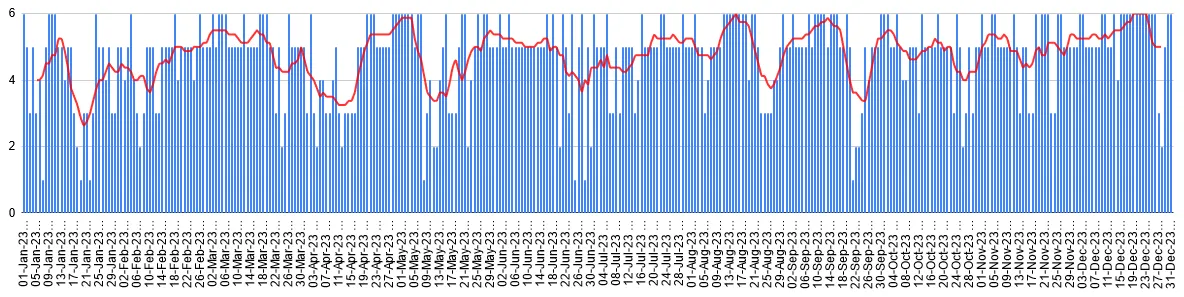
The red line is the 8-day moving average ( 8 because Google sheet only allows even numbers) which gives a general idea of how my weeks went. As it is clearly obvious, there were many highs and lows. This chart was not surprising because there were days spent in grief, mornings not wanting to get up, meals skipped, sleepless nights, aches here and there and what not. There were also days of laughter, fun, passion, friendship, love, joy, silliness and all the precious little things.
Only thing that needs to be noted is that you don’t go low for too long. The longer you are in a sad and depressed state, the harder it is to get out. Know that things will go wrong, you will make mistakes, luck will not always be in your favor, you will lose things but at the end of the day you just have to keep going ( I know, easier said than done).
Here is another way to visualize my 2023 :
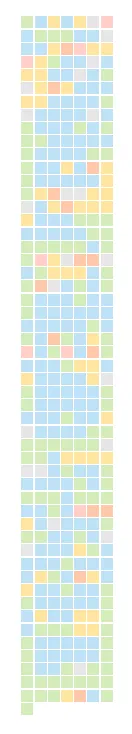
Each cell represents a day. Each row represents a week. The first row is the first week of January. 7*52 such rows would give me 364 days. The last day of the year is that single cell in the last row.
The colors in the diagram are based on the color scheme I used in the Google Sheet.
This diagram makes it clearer that there were some bad weeks but overall I had a beautiful and happy year!
So coming back to the question: Am I happy?
YES!
“In order to have great happiness, you have to have great pain and unhappiness-otherwise how would you know when you’re happy?”
Leslie Caron
Extras:
The HTML code to get the above visualization is given below:
<!DOCTYPE html>
<html lang="en">
<head>
    <meta charset="UTF-8">
    <meta name="viewport" content="width=device-width, initial-scale=1.0">
    <style>
        body {
            font-family: Arial, sans-serif;
            display: flex;
            justify-content: center;
            align-items: center;
            height: 100vh;
            margin: 0;
        }

        .graph {
            display: grid;
            grid-template-columns: repeat(7, 10px); /* Adjust cell width as needed */
            gap: 1px;
            overflow-x: auto; /* Enable horizontal scrolling if needed */
			overflow-y: auto; /* Enable horizontal scrolling if needed */
        }

        .cell {
            width: 10px; /* Adjust cell width as needed */
            height: 10px; /* Adjust cell height as needed */
        }

        /* Define colors based on values */
        .color-6 { background-color: #d4edbc; }
        .color-5 { background-color: #bfe1f6; }
        .color-4 { background-color: #e6e6e6; }
        .color-3 { background-color: #ffe5a0; }
        .color-2 { background-color: #ffc8aa; }
        .color-1 { background-color: #ffcfc9; }
    </style>
</head>
<body>
    <div class="graph" id="graph"></div>
    <script>
        // Replace this array with your set of 365 numbers
        const data = [];

        function createGraph() {
            const graph = document.getElementById('graph');

            for (let i = 0; i < data.length; i++) {
                const value = data[i];

                const cell = document.createElement('div');
                cell.className = `cell color-${value}`;
                graph.appendChild(cell);
            }
        }

        // Create the graph when the page loads
        window.onload = createGraph;
    </script>
</body>
</html>
Comments